According to the BC Assessment Authority, many homeowners in several area communities — including Ashcroft, Cache Creek, Clinton, Lillooet, and Lytton — can expect to see that the value of their property has increased since last year.
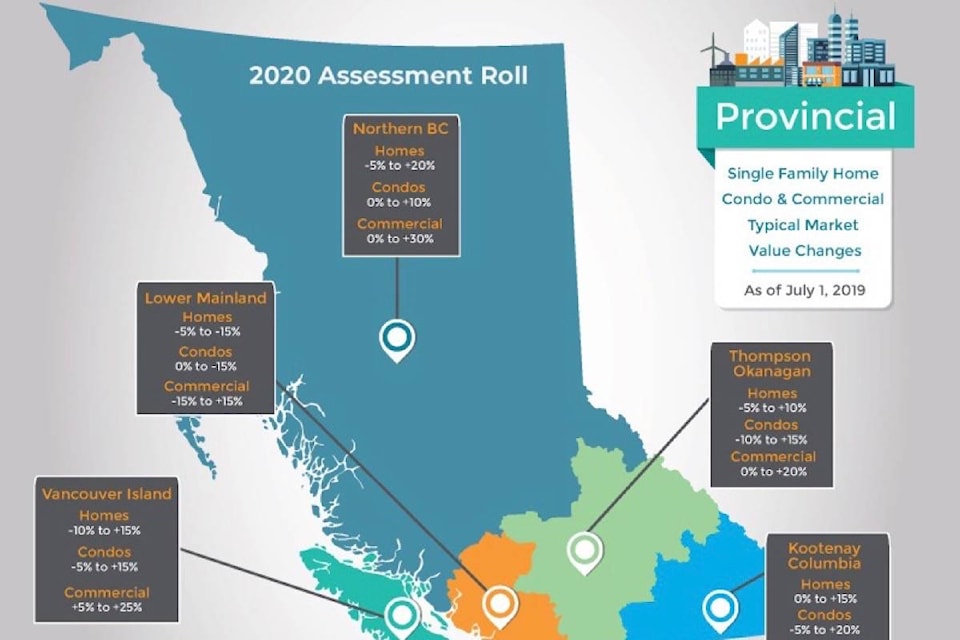
The 2020 assessment notices are in the mail, and reflect the market value of more than 280,000 properties in the Thompson Okanagan region as of July 1, 2019. While the Okanagan has largely remained stable since last year’s assessment, home values have risen consistently for most of Kamloops and the Thompson area, with Ashcroft, Clinton, Lytton, and Lillooet showing the highest increases.
“In terms of dollars it’s not really huge increases,” says Tracy Wall, BC Assessment Thompson Okanagan Deputy Assessor. “But when you look at the percentage [increases] it can be dramatic.”
Clinton has seen the value of the average property increase by $30,000, or 25 per cent, when compared with the 2019 typical assessed value. Ashcroft properties increased by $39,000 and Lytton properties increased by $22,000, both of which are 17 per cent higher than last year. Cache Creek properties increased by $18,000 (11 per cent).
Single Family Homes by Community | 2019 Typical Assessed Value as of July 1, 2018 | 2020 Typical Assessed Value as of July 1, 2019 | % Change |
| City of Kamloops | $431,000 | $461,000 | +7% |
| Merritt | $266,000 | $289,000 | +9% |
| Ashcroft | $222,000 | $261,000 | +17% |
| Barriere | $221,000 | $246,000 | +11% |
| Clearwater | $230,000 | $243,000 | +5% |
| Lillooet | $215,000 | $257,000 | +20% |
| Logan Lake | $230,000 | $245,000 | +7% |
| Cache Creek | $163,000 | $181,000 | +11% |
| Lytton | $138,000 | $160,000 | +17% |
| Clinton | $120,000 | $150,000 | +25% |
Wall says that lack of housing stock is probably one of the causes behind the increased values. “The market is driven by supply and demand, especially if there hasn’t been much building over the years.”
The increase in assessed values in the Thompson region comes as property values have decreased in the previously red-hot Lower Mainland market. “What we’ve seen in many communities over the years,” Wall says, “is that people in the Lower Mainland who are selling their very valuable properties are looking at smaller communities, so that’s part of it.
“And there is also an element of local people selling their home and buying another one in the same community.”
Assessments are based on what a property would theoretically have sold for on July 1 of the previous year. “We look at sales and market activity around that date,” explains Wall. “We try to gather information through sales to determine what the assessments are, and this indicates that there was a lot of activity in these small communities between July 2018 and July 2019.”
She notes that something BC Assessment tries to do is educate people about the correlation between their property assessment and the actual taxes they pay, noting that a 17 per cent assessment increase does not mean taxes will go up by 17 per cent.
“We’ve seen this especially in the Okanagan and Lower Mainland: when assessments were going up, taxes weren’t. This the first year in many years that we’re seeing a downward trend in many communities, but that doesn’t mean taxes are going down. They’ll probably go up by the usual one or two per cent.”
The correlation between property assessments and taxes is explained on the BC Assessment website (https://www.bcassessment.ca/), which Wall encourages people to visit.
“We have a really great public website where you can look up your own assessment and click on all your neighbours to see what their assessment is.”
Homeowners who feel that their assessment does not reflect market value as of July 1, 2019 can appeal it, although Wall notes that the number of people who do this is small.
“The number of people who contest their assessment is very low. Less than two per cent of the two million assessments we do each year appeal, and that number has been consistent since we started in 1974, which is an indicator that we’re doing a good job.”
Appeals must be filed by Jan. 31, 2020 and have to be in writing (letter, email, or through a form on the BC Assessment website). Appeals are heard beginning in early February and last through mid-March, with Wall saying that while anyone can have an in-person hearing, those who would prefer to do it via teleconference now have that option.
“It cuts down on travel and time, and that opportunity is available for most property types.”
However, she encourages people who still have questions about their assessment after visiting the website, or who notice that their assessment contains incorrect information, to call and speak with an appraiser before they launch an appeal. “They’re standing by to answer questions every weekday, and can often answer questions that don’t get answered on the website.”
The website also includes more details about 2019 assessments, property information, and trends, such as lists of 2019’s top valued residential properties across the province. In addition to access to the free assessment search service, property owners can unlock additional property search features by registering for a free BC Assessment custom account to check a property’s 10-year value history, store/access favourites, create comparisons, monitor neighbourhood sales, and use an interactive map. New for 2020, the website is fully mobile-friendly.
editorial@accjournal.ca
Like us on Facebook and follow us on Twitter